User Interface
The user interface is simply an interface in the application layer networking and therefore can be invoked on several machines at once. This allows the flexibility of redundant human operators, or independent human operators in charge of their own subsystem. The GUI allows for human control off-site as well through an XML interface to a gateway node being used in the field. For more information about the application layer networking see that section.
The GUI is divided into five different spaces. The bar across the top allows for user interaction with the map space using quick reference icons. The Upper left pane displays all service discovery, stream subscription, and command status. The lower left pane displays all map layers and allows for each one to be toggled by the user. The right pane provides the user with spatial situational awareness and can show all of the layers controlled by the lower left-hand pane. The bottom bar gives quick status, such as the time, location of the cursor on the map page, and that cursor location's distance from the current position of the node the GUI is running on.
Maps
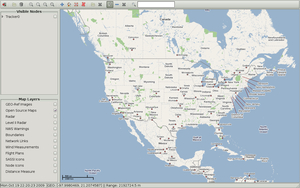
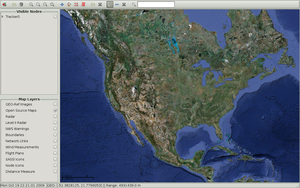
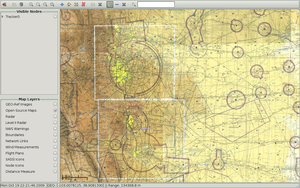
The GUI allows for the user to switch between many different maps with just the click of the mouse. Each map features a tiled, scrollable interface similar to what Google Maps offer without the web interface. Below are examples of road maps, satellite imagery, and aviation charts.
Service Discovery
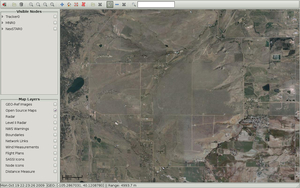
The pane on the upper left displays all status of the service discovery mechanisms. As each node announces itself to the system, its human readable ID is displayed. Should the node fail to communicate its status for longer than a timeout interval (which is set depending on the mission and underlying network) its background will turn red to indicate this status to the user. By twisting down the arrow next to each client, the services/commands that each particular node provides/accepts is displayed to the user.

Stream Subscription
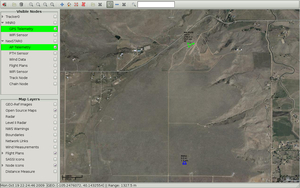
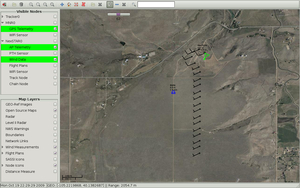
By clicking on the check mark next to each stream, the GUI user is requesting a subscription to that particular stream. Once the first packet is received, the background of the stream will turn green to indicate that the subscription went through. Furthermore, certain streams will show up as extra information in the rest of the GUI space. The following figures show subscriptions to telemetry, flight plans, and wind data respectively.

Node Interface
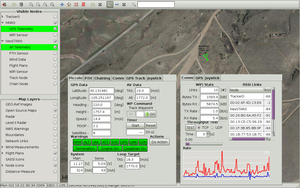
If the user desires further interaction with any particular node, clicking the check box next to the human readable name will bring up an extra window. This window is populated with tabs depending on the services provided by the node. The following figure shows two windows from two separate nodes. One node is an aircraft with an attached pressure, temperature, and humidity (PTH) sonde. The other is a simple mesh network radio (MNR). As you can clearly see, there is very different data to be displayed between the two interfaces. This is all determined dynamically using the service discovery protocol. Furthermore, each window is defined using XML, making it easy to add a GUI for new services/accepted commands.
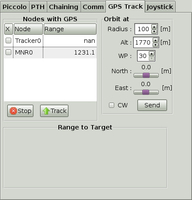
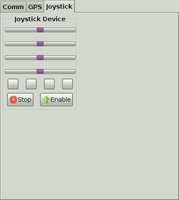
The following two figures show other tabs of each of the previous node windows. Note that both control loop and human interface devices can be used for every node that accepts a particular type of command.
Commands
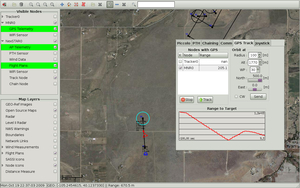
Issuing a command to a particular node is as easy as opening the associated node window and clicking the appropriate buttons. In the example depicted in the following figures, the user commands the UA to track MNR0 by subscribing to its GPS telemetry and using the MNR's current position as an orbit point. Furthermore, the orbit parameters can be adjusted, such as allowing for the orbit point to be positioned in any direction around the node. This is particularly nice when attempting to track an aircraft from a moving vehicle. By allowing a user in the car to position the UA to any side of the car they can better keep it in view and away from visual obstructions.
Similarly, each node accepting flight plans can be sent a flight plan from the GUI. Clicking on the appropriate menu bar item allows for a plan to be drawn. Upon completion, the user may left click the plan they have drawn (or opened from a saved plan) and using the correct modifier key, translate it, rotate it, or change the position of one waypoint. Once the plan is ready to send, the user simply has to right click on it, choose "send waypoint" and then pick the particular client to send it to. The following screenshots show this process.


Tools
The GUI also offers many other tools. There is a flight timer on the node page for any nodes that have an attached autopilot. There is also the ability to set up lost communications and takeoff plans quickly with reference to a particular node in the field. This comes in particularly handy when it is desired to land or orbit an aircraft next to a tracking vehicle in the field. Furthermore, the search bar at the very top center of the GUI provides for reverse geocoding. The user may type in any acceptable string, such as a city and state, and the map center will transition to that location.
Measuring
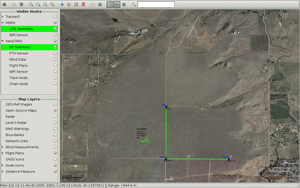
Other tools include the ability to change units used in the GUI, and measure multi-point path distances as shown in the following figure.
Weather Radar
Furthermore, the user may subscribe to any of the level 3 Doppler radar data or weather service warnings available for the United States. The following figures show both the available radar coverage, and the different data streams available to the user.


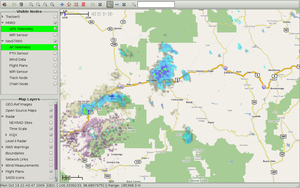
Once a stream has been selected, it will be downloaded and shown on screen. The following figure shows the translucent radar imagery displayed in the GUI. The upper left corner of the map has controls for the radar images that show the time of the current snapshot, and allows for the user "Tivo" like controls to view the radar data. It will continue to continuously download and display the latest data until the user indicates for the service to stop.
Flight Boundaries
The GUI also allows for the user to specify and visualize boundaries. This is particularly helpful when working with FAA Certificates of Authorization (CoAs) or simply when wanting to set a desired area of operation. The boundaries can also be visualized as simple walls, as was the case with Roomba Pacman. Boundaries are opened from KML files, allowing for the user to create boundaries using Google Maps.

Network Links
The GUI can also show network link stats between the various nodes. It monitors throughput and RSSI values and can display them either using a graph, or a line drawn between each communicating node on the screen to indicate available and used bandwidth for each link.
Plotting
Lastly, any of the data that has been shown here can be plotted easily. By pressing the 'p' key, the user activates a series of menus that allows for the selection of data sources to be plotted on the same graph in real time. Multiple plots can be created at once. Example plots have been included in a few of the screen shots above.


 Google Earth

 Maps
Maps

